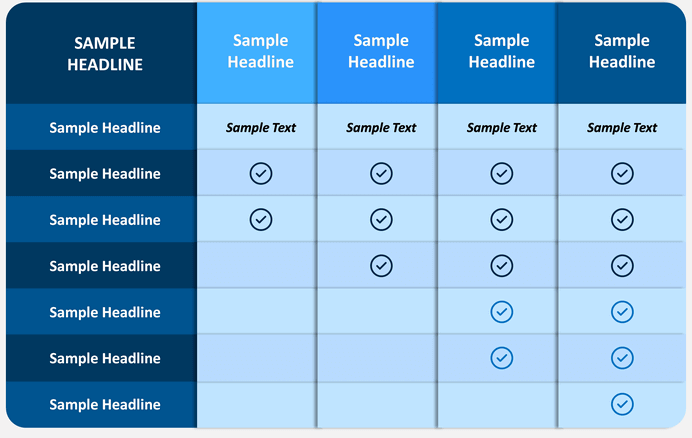
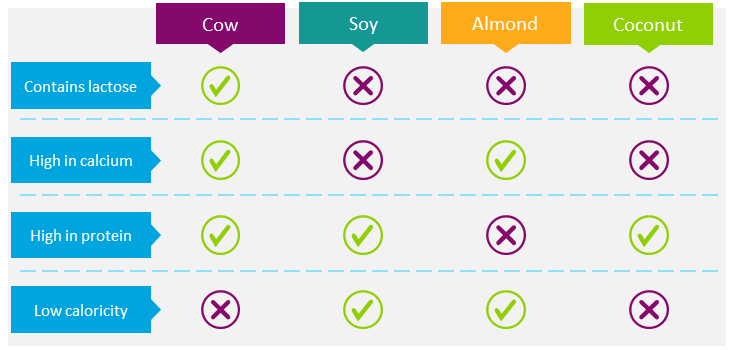
One of the most important things a user does before choosing a particular product or plan is to compare the available options. A comparison table is a simple, well-known design pattern that helps a user make purchasing decisions.
The most common instances of comparison tables are indeed for mid-range to expensive consumer goods like microwaves, fitness trackers, etc. However, comparison tables are equally well-suited to services, membership levels, pricing packages, software features, and even more.
The comparison table is a much more versatile tool than it gets credit for which can lead to more purchases. But you need to make that the comparison table is used for a reason and doesn’t overwhelm the webpage.
There are two most common ways of creating a comparison table. You can create a comparison table either using knowledge skills or with the help of a special plugin.
This article s dedicated to creating a comparison table with the help of the WordPress plugin.
Among the abundance of plugins, you can easily get confused while looking for the one that is suitable for the niche of your particular website because not each plugin can do what you need. That’s why it’s important to find the right one.
How to Create a Comparison Table with Data Table WordPress plugin?
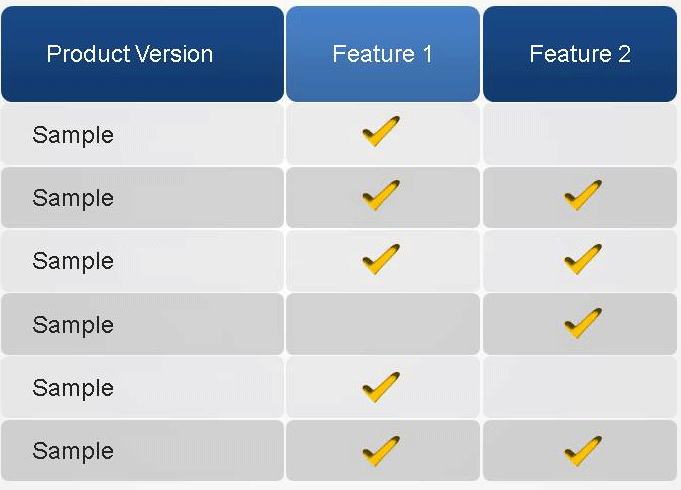
PubyDoc Data Table and Charts is a plugin made for WordPress which allows creating responsive tables suitable for different usages. With the help of the plugin, you can create a comparison table in a few clicks. All you need to do is to enter the data, customize its appearance and just post it to the page.
Furthermore, this WordPress plugin allows the building of different types of charts. What’s even more, the plugin includes several other common advanced options to work with tables.
Among the advanced features are:
- Responsive Design
- Conditional Formatting
- Customize tables
- Sorting
- Word wrap
- Scrollable
- Row Grouping
- Table export tools
Those are not all features a plugin has. You can all of them here.
Besides, except for a comparison table, you can create other types of tables for your website.
Statistics Tables with Charts
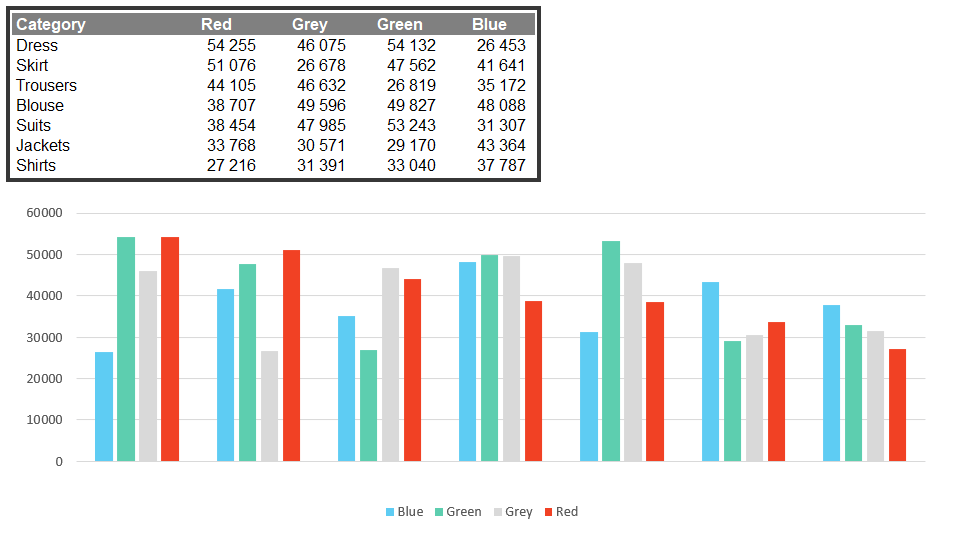
The main functions of a chart are to display data and invite further exploration of a topic. Charts are used in situations where a simple table won’t adequately demonstrate important relationships or patterns between data points. Data Table and Charts plugin is a perfect tool to create a graphic representation of data in charts.
Pricing Table
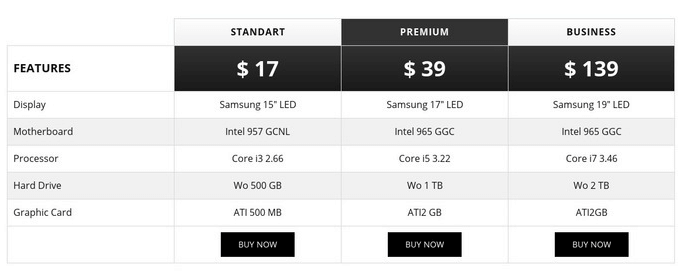
Pricing tables allow you to present your offer to your visitors in a very elegant way. Make what you sell attractive. This will make it easier for customers to understand what you offer and on what terms. The stylization settings allow customizing a table according to your needs. The interface is user-friendly so there are no difficulties in its customization.
Media Content
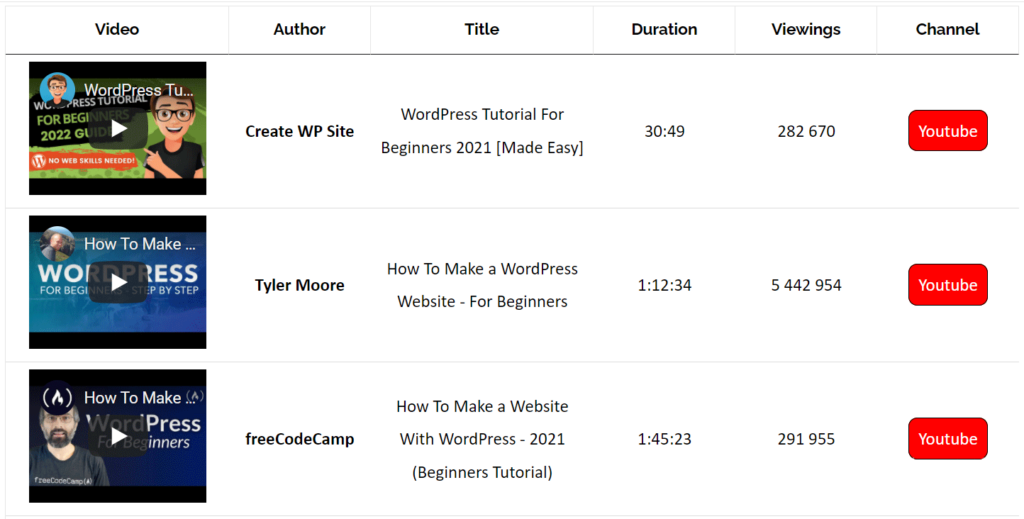
PubyDoc Data Table and Charts are suitable for displaying any type of data, including audio, video files, and other multimedia content. For example, you can include an MP3 music player embedded videos, or Youtube videos. That’s extremely useful if you need to create a list of movies’ trailers or video guides.
Financial Reports
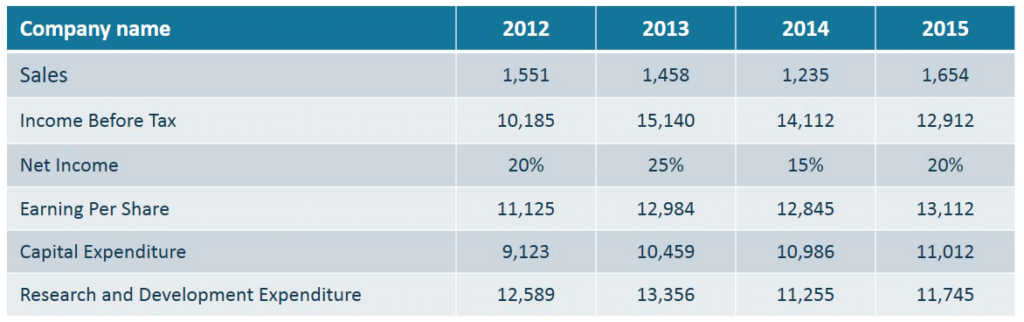
Data Table WordPress plugin is suitable for creating financial reports. because financial information often includes a lot of discrete individual entries which read most easily when they are laid out in a table format.
Goods Catalog
Data Table WordPress plugin can quickly and efficiently convert product data into simple tables, creating a table row for each product record within the data.
That’s not the whole list of example usage where tables come in handy. For example, you can create a catalog of drivers, subscription plans, book reviews, a list of football clubs, and so on.