How to use preview in charts?
Preview mode is a perfect option that displays exactly how the content will look when goes live so that the corrections can be made before the launch. Preview mode in charts allows seeing the changes in the charts in real-time.
To find out how to create and style up the charts, please read this article.
Let’s take a look at how to use preview mode in the PubyDoc Data Table and Charts plugin.
Axises
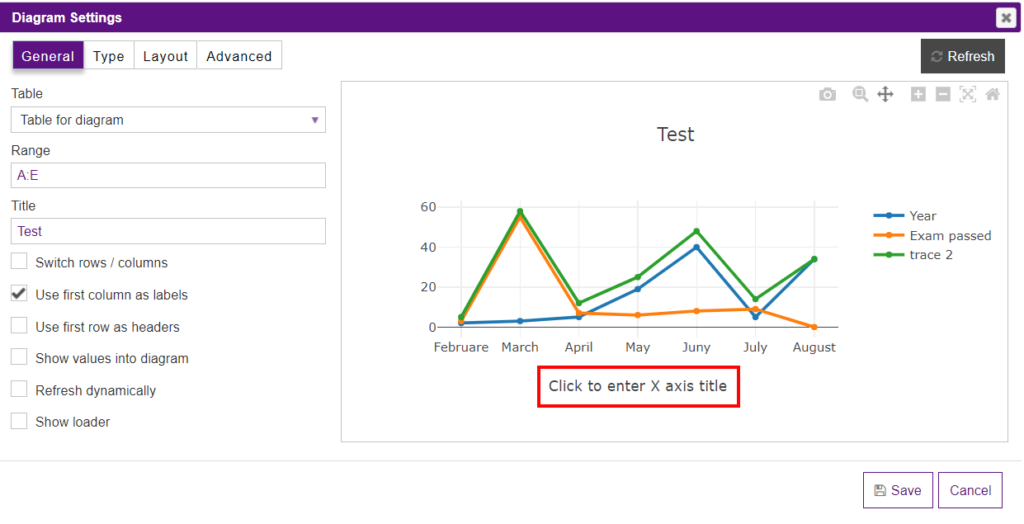
The name of the X-axis and Y-axis can be changed by hovering and clicking on them.
Legend
Preview mode also allows changing the position and the content of the legend.
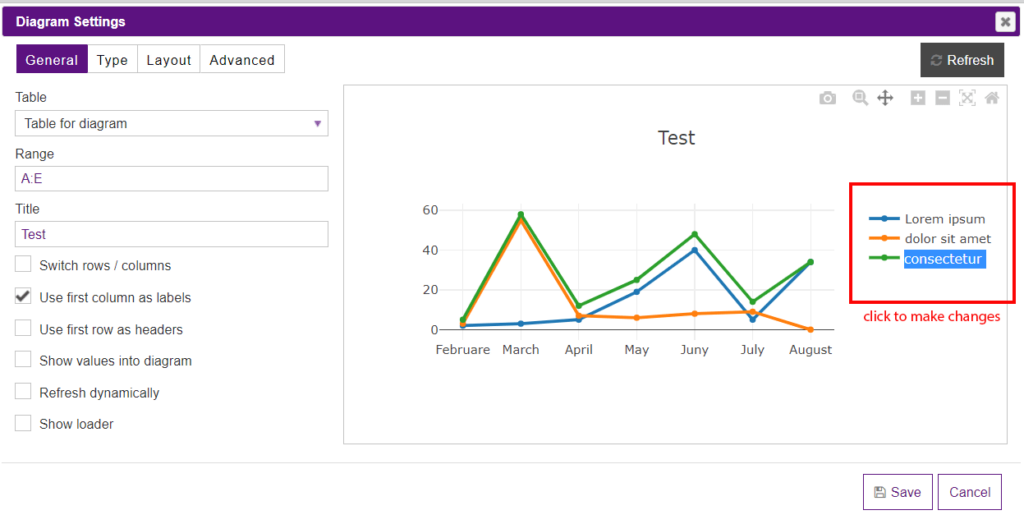
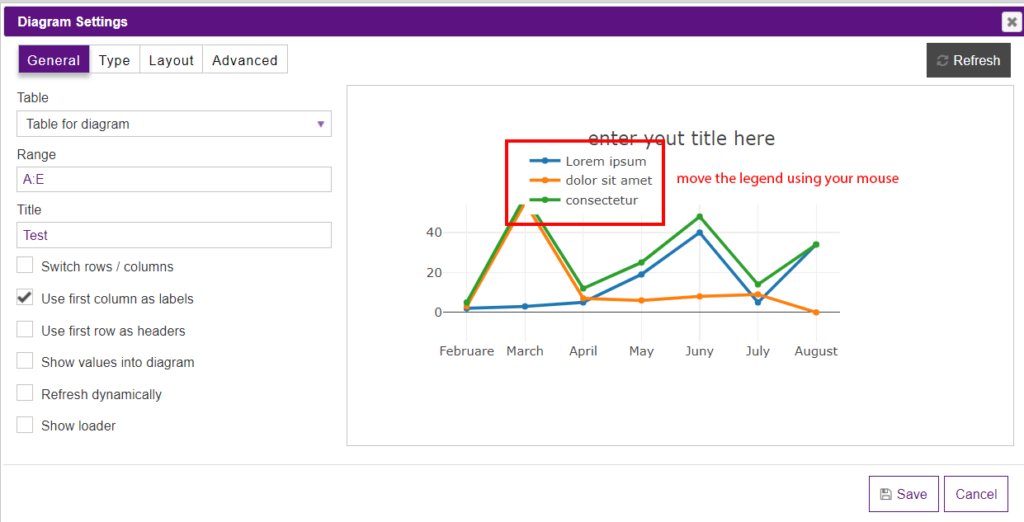
To relocate the legend you can just grab and move it. To change the items, you just need to click on them.
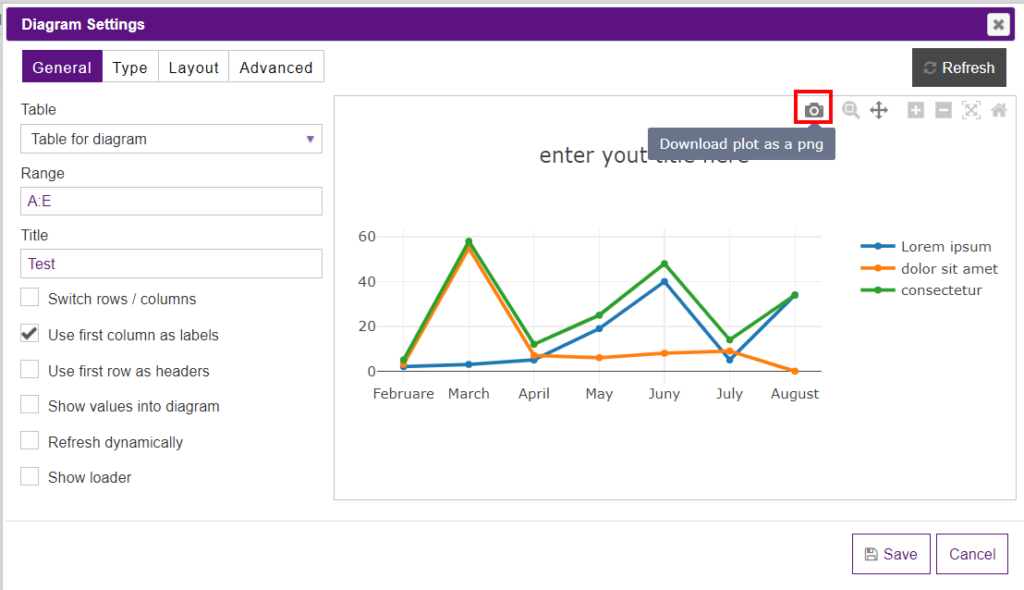
Downloading
The preview mode has an option to download the chart as png. To do so you need to click the camera icon.
Other options
You can also Zoom in and Zoom out charts using either the corresponding icons or spin the mouse wheel.
If you select the Spin option, you can move charts and legends.
The Autoscale option automatic resources scale.
The Reset axes option allows you to reset the changes you do with X-axis and Y-axis.