Let’s say you want to host a Leaderboard on your WordPress website, it’s not as hard as it seems at first glance, for example, one possibility is to embed a script from an external website. However, this entails various security issues and is also a slower process.
Another possibility is to add the table directly using the WordPress visual editor. This offers limited table customization to suit your needs.
The third option is to use the PubyDoc DataTable and Charts plugin. With this plugin, you can easily create tables and fully customize them.
Below we have given an example of the English Premier League Tournament Table created using the PubyDoc DataTable and Charts plugin.
| Team | M | W | D | L | F | A | GD | Pts | ||
|---|---|---|---|---|---|---|---|---|---|---|
| 1 |
|
Manchester City | 23 | 18 | 3 | 2 | 55 | 14 | 41 | 57 |
| 2 |  |
Liverpool | 22 | 14 | 6 | 2 | 58 | 19 | 39 | 48 |
| 3 |  |
Chelsea | 24 | 13 | 8 | 3 | 48 | 18 | 30 | 47 |
| 4 |  |
Manchester United | 22 | 11 | 5 | 6 | 36 | 30 | 6 | 38 |
| 5 |  |
Tottenham | 23 | 11 | 4 | 8 | 41 | 31 | 10 | 37 |
| 6 |  |
Aston Villa | 21 | 11 | 3 | 7 | 33 | 25 | 8 | 36 |
| 7 |  |
Leister City | 20 | 11 | 3 | 6 | 26 | 24 | 2 | 36 |
| 8 |  |
Arsenal | 21 | 10 | 4 | 7 | 19 | 16 | 3 | 34 |
| 9 |  |
Everton | 22 | 6 | 12 | 4 | 23 | 23 | 0 | 30 |
| 10 |  |
Newcastle United | 20 | 7 | 5 | 8 | 34 | 37 | -3 | 26 |
| 11 |  |
West Bromwich Albion | 21 | 8 | 2 | 11 | 28 | 32 | -4 | 26 |
| 12 |  |
Crystal palace | 22 | 5 | 10 | 7 | 26 | 34 | -8 | 25 |
| 13 |  |
West Ham United | 22 | 5 | 9 | 8 | 31 | 34 | -3 | 24 |
| 14 |  |
Burnley | 23 | 6 | 5 | 12 | 26 | 38 | -12 | 23 |
| 15 |  |
Brighton & Hove Albion | 21 | 5 | 7 | 9 | 24 | 40 | -16 | 22 |
| 16 |  |
Leeds United | 20 | 5 | 4 | 11 | 24 | 35 | -11 | 19 |
| 17 |  |
Sheffield united | 22 | 4 | 4 | 14 | 13 | 45 | -32 | 16 |
| 18 |  |
Southampton | 21 | 2 | 9 | 10 | 21 | 43 | -22 | 15 |
| 19 |  |
Fulham | 20 | 4 | 2 | 14 | 23 | 40 | -17 | 14 |
| 20 |  |
Wolverhampton | 18 | 1 | 9 | 8 | 16 | 27 | -11 | 12 |

Now let’s take a look at what options we used to create such a table.
Since this is still a blog article, we will not delve into the functional component. But all manipulations are performed without a single line of program code, using only understandable plugin options.
To begin with, we created a table with 20 rows and 11 columns and filled it with content.
For the first column. we used auto-indexing. The option will automatically number the columns.
For the second column with the image of the column logo, we used a column of type File Upload and uploaded the images. Although in exactly the same way we could load images via an HTML column.
For the third column, we used the Single Line Text type for the command names. If you want to add a link, we recommend using the Insert link option in the Extended Builder.
We gave the rest of the columns the Numerical Value type with Number format “1” so that the numbers are multiples of one.

At the same time, it is not necessary to fill in all the numeric cells, because the plugin fully supports formulas that you may be familiar with working with Excel.
For example, using formulas, we calculated the goal difference column, subtracting goals conceded from goals scored and the like. (for example “=H1-I1” and so on)
Another cool feature is that you don’t have to make the first command first in the table, because the “Enable Multiple Sorting” option can display the applied sorting right at the front. In our example, sorting in descending order is worth points.
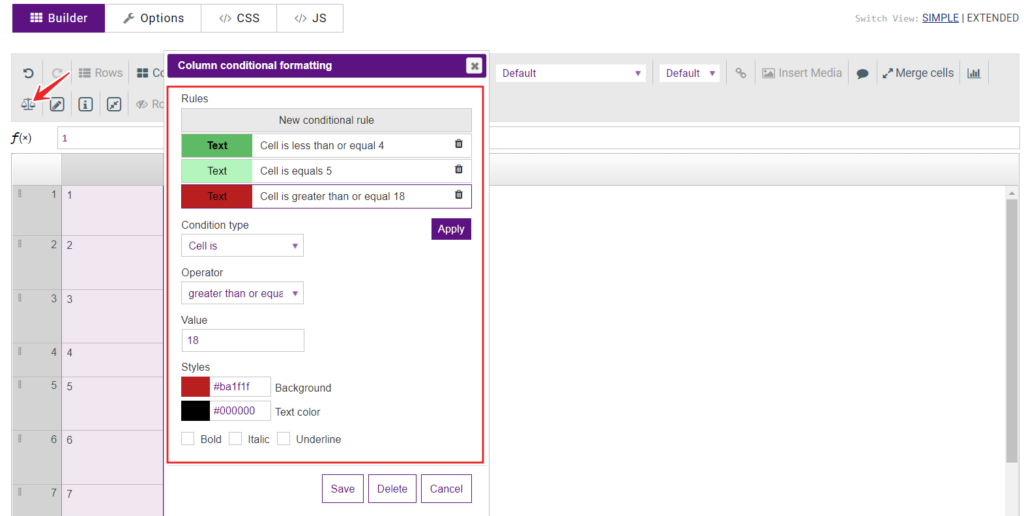
You may have noticed that in the first column, the first 4 places are highlighted in green, the 5th place is highlighted in bright green, and places 18-20 are highlighted in red. This is usually denoted: teams that get into European competitions (green) and teams that fly out of the current division (red).
Due to the fact that PubyDoc DataTable and Charts fully supports “Conditional Formatting“, setting this up will not be a problem.
Well, with the final touch, we decided to emphasize the rows of the table by removing the column borders.
In this way, you can create vertical comparison tables for any purpose, but we have only shown one of the possible examples.