Everything is great in WordPress – an intuitive interface, ease of use, and setup, but there is one simple thing missing – the ability to structure data via a table through a graphical post editor. Thanks to its eco-friendliness you can install different plugins that complete this feature, but how to select the right one among the huge variety of them? Not all plugins are suitable. The PubyDoc Data Table and Charts is an easy-to-use plugin for table creating that doesn’t require any coding skills. Let’s dive deeper into the useful features of the plugin that surely come in handy.
If you are looking for the opportunity not only to create a simple table but the option of merging cells, sorting, searching, and using pagination for the user’s convenience, then you’re in the right place. With the plugin, you can merge table cells and work with columns and rows separately. If you add a search or sort option to a table you’ll save time for users. Some visitors don’t like spending time switching to different pages in a search for the info, so including a search bar or sort is surely what you need to keep a user on the website for as long as possible because we all agree that time is money.
| Photo | First Name | Last Name | Age | Direction | Residence | Position | Date | Salary | Shares | Portfolio |
|---|---|---|---|---|---|---|---|---|---|---|
 |
Mike | Smith | 41 | Software | Toronto, Canada | Project Manager | 07/11/2011 | $100000 | 2.50% | |
 |
Robert | Greenwood | 35 | Software | Bergamo, Italy | UI designer | 02/01/2022 | $120000 | 2.00% | |
 |
Bobby | Kroos | 33 | Software | Keln, Germany | Developer | 04/01/2022 | $75000 | 1.00% | |
 |
Harry | Lineker | 32 | Software | Oslo, Norway | Developer | 09/01/2014 | $110000 | 1.00% | |
 |
Elaina | Jones | 27 | Software | Melbourne, Australia | UX designer | 05/06/2017 | $60000 | 0.45% | |
 |
Tetyana | Korsun | 27 | Gamedev | Kyiv, Ukraine | Developer | 10/01/2022 | $77000 | 0.20% | |
 |
Gregory | Brown | 24 | Gamedev | Dortmund, Germany | Developer | 11/01/2022 | $80000 | 0.10% | |
 |
Lili | James | 24 | Software | Miami, USA | Developer | 01/10/2022 | $70000 | 0.10% | |
 |
Jeam | Szcherbatski | 24 | Gamedev | Praha, Czech | Developer | 01/10/2022 | $90000 | 0.00% | |
 |
Alex | Mereshko | 21 | Gamedev | Moscow, Russia | Tester | 01/03/2022 | $50000 | 0.00% | |
 |
Julia | Mount | 22 | Gamedev | Kyiv, Ukraine | Tester | 01/03/2022 | $44000 | 0% | |
 |
Jessica | Asensio | 18 | Software | Madrid, Spain | Tester | 21/01/2022 | $35000 | 0% | |
 |
Mark | Zapatski | 18 | Gamedev | Toronto, Canada | Tester | 01/10/2022 | $35000 | 0% |
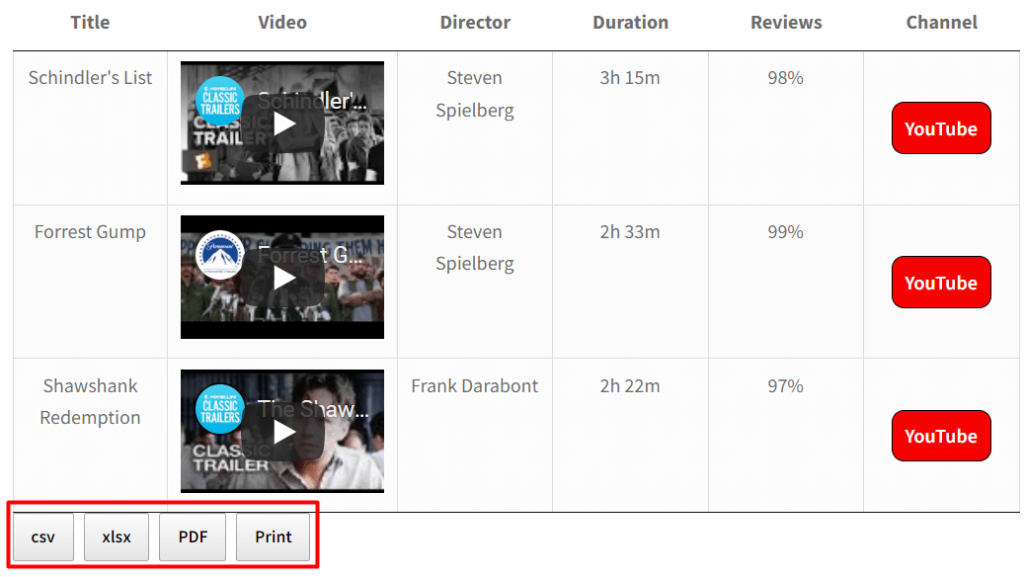
We often deal with tables even when we don’t pay much attention to them. For example when reading a short description of a movie or book on Wikipedia. Being able to download this kind of information is an extremely advantageous feature. Data Table WordPress plugin has Frontend Export available in CSV, MS Excel 2007(.xlsx), MS Excel 2003 (.xls), PDF. What’s even more, a visitor can print a table right from the website.

Almost all plugins for WordPress have a built-in option for Import/Export the data and Data Table and Charts plugin is not an exclusion. You can export a separate table in Excel or CSV format. Several or more tables can be exported in SQL files. If you already have a table created in Google Sheet, you can import it to your website via the plugin.

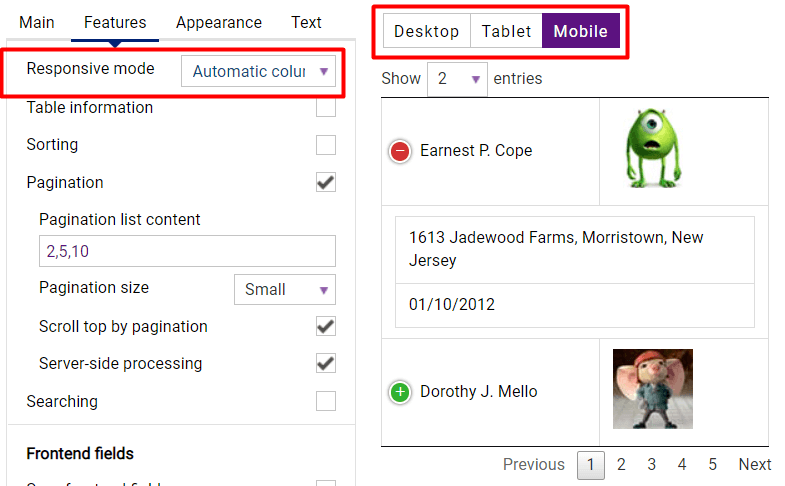
Of course, how without Responsive mode. Your website will be probably seen from different gadgets and responsiveness is necessary for every web page. Data Table and Charts plugin has such adaptive modes as Standard Responsive mode, Automatic column hiding, and Horizontal scroll. You can set it to Disable Responsivity if necessary. If table content doesn’t fit all columns become under each other with one cell per row then Standard Responsive mode is set. If you select the Automatic column hiding option the table columns will collapse from right to left if the content does not fit to parent container width. The Horizontal scroll option will create a scroll bar if the table overflows the parent container width. You can check the changes directly in the table setting preview mode.

In addition to the mentioned features, you can always add any type of media content to a table and turn it into a tooltip so that the content is shown on hover.

If you have a deal with currency or rating displaying, there is the cell formats option in the plugin helping to set the number in the readable format. You can set the needed format for a separate cell, a few selected cells, or for a whole column.
| Thumbnail | Name | Category | Season | Price | Stock | Button |
|---|---|---|---|---|---|---|
 |
Sneakers Nike | Sneakers | Demiseason | $90 | 124 | |
 |
Sneakers Nike | Sneakers | Demiseason | $110 | 24 | |
 |
Sneakers Nike | Sneakers | WInter | $55 | 512 | |
 |
Sneakers Nike | Sneakers | Demiseason | $120 | 54 | |
 |
Sneakers Nike | Sneakers | Demiseason | $100 | 23 | |
 |
Converse sneakers | Sneakers | Summer | $70 | 235 | |
 |
Sneakers Nike | Sneakers | WInter | $45 | 1 | |
 |
New Balance sneakers | Sneakers | Summer | $50 | 24 | |
 |
Sneakers | Sneakers | Demiseason | $34 | 65 | |
 |
Vans sneakers | Sneakers | Summer | $100 | 90 |
We go nowhere without charts. To visualize the table data into the eye-catching format, PubyDoc Data Table and Charts has a varied selection of charts for any occasion.
Even though the plugin has default styling settings, we understand that you may need to create your appearance. For this purpose, there is a CSS editor.

That is not the whole list of benefits you can get using the Data Table WordPress plugin. With the help of the plugin, you won’t spend time creating data by digging into the code. You can learn more from our detailed documentation.